

The wire hits and decades of work have just become the largest liquidity event of your life. Then comes the second number…the one you owe the IRS.
Ideally, tax planning starts well before closing, when owners have the most flexibility. But just because the ink has dried, it doesn’t mean the window has fully closed. While post-sale strategies can’t eliminate the entire liability, they can potentially reduce, defer, or offset a portion of it.
The catch? All else equal, certain strategies that save the most in taxes may lead to concentration or overexposure to a particular sector or strategy. Put simply, tax planning should support your investment plan, not replace it. So how do you capture meaningful savings without letting taxes dictate your next move?
How to Cut Taxes After a Business Sale Without Derailing Your Portfolio
Consider Joanna, a Florida resident who recently sold her business for $40 million with no advance planning. She received $30 million in cash at closing while rolling $10 million of equity into the acquiring company. Assuming a federal capital gains tax liability of approximately $6 million,[i] Joanna is left with $24 million of after-tax liquidity from the cash portion of her deal.
Like many business owners, Joanna had two primary goals:
- Reduce the taxes associated with the sale.
- Build a diversified portfolio that could support her family’s long-term financial goals.
At first glance, these goals seem perfectly aligned. But in reality, they often conflict. Strategies that generate the largest tax benefits frequently require committing capital to more specialized investments, potentially reducing liquidity, diversification, or flexibility.
Since Joanna and her family did not have any philanthropic intent, she and her advisors decided to explore several possible strategies before committing to any investments.
How Direct Indexing Offsets Gains from a Business Sale
One option Joanna evaluated was a direct indexing strategy.
Rather than owning a single index fund, direct indexing portfolios typically hold hundreds of individual stocks designed to closely track a benchmark like the S&P 500. Because the securities are held individually, positions that decline in value can be sold, potentially generating capital losses that may offset gains from the sale of the business.
While loss recognition is not guaranteed, on average, and over a full calendar year, investors can expect to generate roughly 11% in capital losses[ii] per $1 invested in a direct indexing strategy. In other words, for every $1 million invested, you potentially receive about $111,000 of capital losses that could be used to offset the transaction’s gain. Keep in mind, business owners looking to offset such gains must realize losses by December 31 of the year of sale.
The bottom line? For those seeking broad US equity exposure, direct indexing portfolios can provide a compelling combination of investment exposure and tax management.
Using Long/Short Direct Indexing to Accelerate Tax-Loss Harvesting
Joanna also considered a slightly different flavor of the direct indexing strategy described above. The difference lies in its use of leverage in its attempt to generate more capital losses.
This strategy, often referred to as long/short loss harvesting, expands the opportunity set by adding both additional long and short positions. For example, a 130/30 strategy may invest 130% of the portfolio in long positions while maintaining 30% in short positions, leaving net equity exposure of approximately 100%.
In effect, this gives Joanna $160 worth of securities to manage her tax exposure rather than just the $100 at work in the traditional direct indexing strategy. As a result, the expected loss over the first full calendar year increases to about 23% per $1 invested.[iii] At slightly more than twice the loss rate of direct indexing, this strategy may prove particularly advantageous for those with less time to generate capital losses because they’ve already sold. It also appeals to business owners like Joanna with rolled equity. Since losses not utilized in a given year can be carried over, such sellers often look to implement a strategy before their second sale.
Of course, there are trade-offs. When using direct indexing (with or without leverage), harvested losses are a “tax deferral” not a “tax avoidance” strategy. They generally reduce the portfolio’s tax basis, potentially creating future gains down the road, unless the portfolio receives a step-up in basis at the owner’s death. Long/short portfolios also come with heightened complexity, financing costs, and implementation considerations.
Still, for an investor who wants US equity exposure, the strategy may serve both an investment and tax-planning purpose.
Why Opportunity Funds Can Defer Gains from a Business Sale
Joanna also explored allocating a portion of her proceeds to a Qualified Opportunity Fund (QOF).
Under new rules beginning in 2027, eligible gains invested in a QOF can generally be deferred for five years, while allowing for a basis step-up of at least 10% or 30% for investments in rural areas.[iv] What’s more, any gains within the QOF can be avoided if held for 10 years. Notably, QOFs tend to offer no liquidity. That means investors should plan to fund the tax payment with other assets when the tax deferral period ends in year five.
While these tax advantages are nice features, QOFs are less liquid than traditional stock and bond investments and can be riskier than other types of real estate investments. In other words, tax benefits can enhance a sound investment, but they generally can’t make up for a weak one. As a result, the question was not whether Joanna should use a QOF. The real question was how much exposure made sense given her overall goals?
Maximum Tax Savings or a Balanced Portfolio: Which Works Better After a Sale?
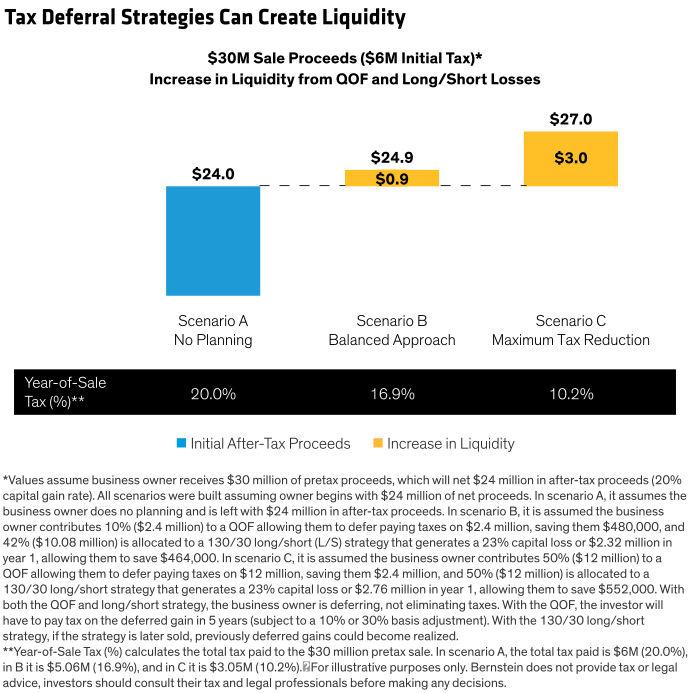
After evaluating the available strategies, Joanna’s advisor illustrated three potential outcomes using $24 million of after-tax proceeds as the starting point for each scenario (Display).
- No Planning (Scenario A): Joanna could simply pay the tax bill and invest the remaining proceeds in a traditional diversified portfolio of stocks, bonds, and alternatives. This approach maximizes simplicity and liquidity while foregoing the tax benefits.
- Maximum Tax Reduction (Scenario C): At the other extreme, Joanna could aggressively pursue tax mitigation by evenly splitting her after-tax proceeds between a QOF and a long/short direct indexing strategy. Though using tax deferral strategies generated the largest immediate tax benefit—$3 million of incremental liquidity—the approach also concentrated Joanna’s portfolio in just two specialized strategies, one of which was locked up for 10 years. The extra $3 million looked attractive on paper, but the portfolio no longer addressed her broader objectives.
- A Balanced Approach (Scenario B): Ultimately, Joanna found the middle ground. She allocated roughly 42% to a tax-aware long/short direct indexing strategy (the optimal amount of US equities her advisor recommended for a moderate portfolio), and 10% to a QOF, which avoided overexposure to a single strategy. The remainder was invested across traditional asset classes like international equities, fixed income, alternative investments, and liquid reserves.
Though it didn’t produce the lowest possible tax bill, the blended approach still reduced Joanna’s capital gain from $30 million to about $25 million, resulting in additional liquidity of nearly $1 million. Plus, it allowed her to better align her portfolio with her long-term investment goals. Her tax in year 1 as a percent of the sale declined from 20% to 16.9%, but more importantly, she ensured tax considerations didn’t overwhelm her investment decisions.
Why the Lowest Tax Bill Isn’t Always the Best Outcome After a Business Sale
Joanna’s story highlights a lesson many business owners overlook after a liquidity event: the goal isn’t always the lowest possible tax bill. It’s a portfolio you actually want to own. So start there then decide where tax-management tools fit within that portfolio and size them appropriately. Done thoughtfully, this approach can improve after-tax outcomes without sacrificing diversification, liquidity, or investment discipline.
[i] Tax computation assumes Joanna is not subject to the 3.8% Net Investment Income Tax (NIIT).
[ii] Source: AB and Standard & Poor’s. Based on evaluating the impact of a direct indexing strategy launched beginning in 1998 through 2024 (27 1-year periods). Simulated or hypothetical performance results have certain inherent limitations. Unlike the results shown in an actual performance record, these results do not represent actual trading. Results include estimates of trading costs and market impact; however, because these trades have not actually been executed, results may have under- or overcompensated for these costs. Simulated or hypothetical trading programs in general are also subject to the fact that they are designed with the benefit of hindsight. No representation is being made that any account will or is likely to achieve returns or a volatility profile similar to those being shown.
[iii] Source: Quantinno. The results achieved in our simulations do not guarantee future investment results. The model performance information is based on the targeted performance of hypothetical investments over the time periods indicated. It is possible that the markets will perform better or worse than shown in the projections; that the actual results of an investor who invests in the manner these projections suggest will be better or worse than the projections; and that an investor may lose money by investing in the manner the projections suggest.
[iv] Rural area is defined as a QOZ with a population of less than 50,000.
Advice for Business Owners
Learn more about our focus on entrepreneurs and the professionals advising them.